Building Observability into Distributed Applications
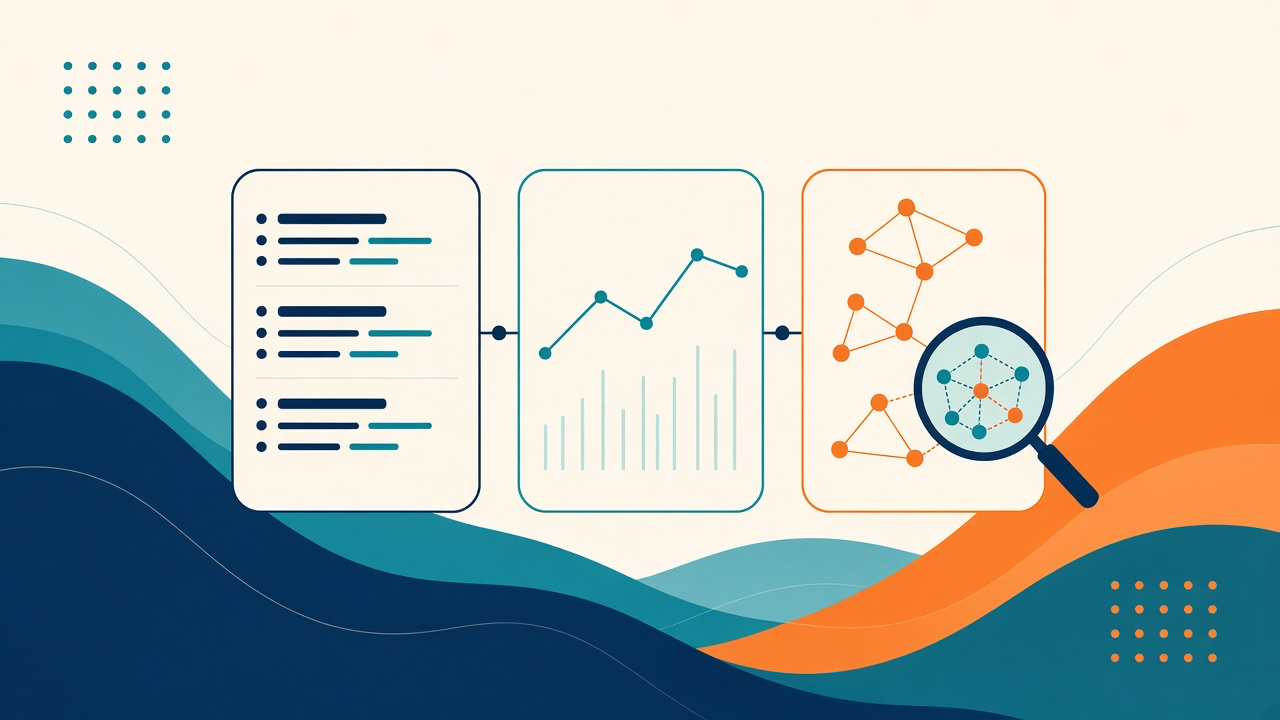
In a single process, a stack trace often tells you enough. In a distributed application, one user action crosses an API, a queue, a database, and a third party. The failure is a missing link between those hops. Observability is how you keep that link.
Logs, metrics, and traces are the tools. They only work if every service speaks the same correlation id and you alert on symptoms customers feel.
Three Signals, Three Jobs
Metrics answer “how much, how fast, how often.” Request rate, error rate, and latency by endpoint. Queue depth. Saturation of CPU, memory, and pools. They are cheap to keep and they drive alerts.
Logs answer “what happened to this request.” Structured fields, not a paragraph you must parse with a regex. One line per significant event, with ids, not a dump of the payload.
Traces answer “where did the time go.” A trace ties spans across services so you can see that checkout was slow because the payment client waited, not because the cart service was busy.
You need all three. Metrics tell you to look. Traces tell you which hop. Logs tell you the reason code.
Put the Correlation Id in First
Edge receives the request and assigns or forwards a trace id
    ↓
Every service logs and spans with that id
    ↓
Messages on the queue carry the id
    ↓
Outbound calls to partners send it where the partner allows
    ↓
The support tool can paste one id and see the whole path
If the id dies at the queue boundary, you will debug the API and the worker as if they were unrelated incidents. Propagate it on purpose. Do not rely on someone remembering to add it in a new service.
What to Measure on Every Service
For each request-serving service, the minimum set is:
- Rate, errors, and latency (include p95 and p99)
- Latency and errors broken out by dependency
- Saturation: pool wait, queue lag, CPU
For workers: jobs taken, jobs failed, age of the oldest message, and processing time.
Use low-cardinality labels. endpoint and status are useful. userId or raw orderId on a metric will blow up the time-series database and the bill. High-cardinality detail belongs on the trace and the log line.
Alert on Symptoms
Page when users are affected or are about to be: error rate above a threshold for five minutes, p95 latency past the SLO, queue age past the business SLA, a dependency error budget burning.
Do not page on a single log line, a container restart that recovered, or CPU at 70 percent with healthy latency. Those are charts for the next business day. Every alert needs an owner and a first question to ask. An alert with no runbook is noise you will mute.
Logging Without Making It Worse
- Structured JSON with level, service, trace id, and a stable event name
- No card numbers, tokens, or full identity documents
- Sample success logs if volume is extreme; keep all errors
- A retention period finance and security have agreed to
Logging every payload at info level will slow the request and hide the one field you needed. Log the ids and the decision. Fetch the payload from the system of record when an investigation requires it.
How to Adopt It in an Existing System
Start at the edge and the payment or order path, not with a mandate to instrument forty services in a sprint. Add the trace id, RED metrics, and one dashboard per critical journey. Then instrument the next hop the first incident points at. Observability that follows real incidents gets finished. Observability that starts as a platform project often stalls.
Define an SLO for one journey (checkout, payout, EDI acknowledgment) so the dashboard has a line that means “good.” Without that line, every spike looks equally urgent.
Conclusion
Distributed applications are observable when one id crosses every hop, metrics show rate and latency, traces show the slow dependency, and alerts fire on customer symptoms. Build that path on the journeys that move money or orders. The rest can follow the next incident.
Connect With Us
At KIS Technology, we help businesses transform their ideas into secure and scalable digital solutions through software development, API integration, and quality engineering.
Build smarter. Build securely. Build for growth.
Connect with our Founder: